There’s an old adage: “Horsepower sells cars; torque wins races”. The “horsepower vs. torque” contest has been going on for a long time, which shouldn’t be a huge surprise. It’s an issue that lends itself to misunderstanding and confusion. Let’s see if we can clear things up.
The Merriam-Webster definition of the noun “torque” is: “a force that produces or tends to produce rotation or torsion”. Likewise, their definition for horsepower is: “a unit of power equal in the U.S. to 746 watts and nearly equivalent to the English gravitational unit of the same name that equals 550 pound-feet of work per second”. Pay special attention to the “pound-feet of work per second”!
Watt? What?
James Watt perfected the steam engine and envisioned the myriad of uses for it. One challenge was to convey to people the amount of power the engine developed, using terms that they might understand. Thus was born the term “Horsepower”. Watt figured that a work pony could lift 550 pounds one foot per second. This he defined as one horsepower. Of course, the definition has expanded to include other types of power, such as electrical power.
The unit of power in the international system of units (SI) is the Watt.
Work A force and movement in the direction of the force.
Energy Potential to do work; same units as work. (“Currency” of work)
Power The rate at which work is performed or the rate of using energy (same thing).
POWER = (WORK) ÷ TIME This is a key formula!
WORK = FORCE x DISTANCE
So…
POWER = (FORCE x DISTANCE) ÷ TIME …so is this!
What we need now is a good example!
An Example

Let’s say that you have a pallet of bricks with a total weight of 500 pounds, and that you need to move the bricks from where they are to a spot 20 feet directly above them. Let’s further say that there are two different but identical pallets, one at the front of the building and one at the rear. The pallet at the front of the building can be lifted up and into place with a lift, but the lift can’t access the back of the building. (Don’t worry how the pallet of bricks got there in the first place…) Moving this 500lb straight up 20 feet is going to involve 500 x 20 = 10,000 lb.-ft. of work and an equal amount of energy.

It takes the lift 30 seconds to complete the lift, while it takes you two hours of going up the ladder with a load on your shoulder. In both cases 10,000 lb.-ft. of work is done. Sure, the lift does the work much quicker, but the amount of work is the same.
So, either method of lifting the bricks requires the same 10,000 lb.-ft. of work and energy. What is going to be vastly different, though, is the rate this work is done. Note that the horsepower term is “…of work per second.” Since we’re dealing with two entirely different periods of time, 30 sec. for the forklift and 2 hr. for you with your ladder, the levels of power are going to be way different. You did the same amount of work as the forklift did, but it took you 240 times longer (120min ÷ 30sec = 240). This means that you applied 1/240th the power, but for 240 times as long. Regardless, the work is the same!
You Must Have Motion!
We’ve seen that work involves force and movement (but not time). If you strain at lifting the 500 lb. pallet, moving it not one millimeter but suffering the mother of all hernias in the process, you have done zero work. That should be somewhat intuitive. Force was applied, but work was not done (your hernia notwithstanding).
Horsepower From Torque and Speed
When an engine or a car is dynamometer tested, it is the torque that is measured, and the horsepower is then calculated from the torque; this is done by the dyno itself. With engine output, it’s revolutions per minute, RPM, that’s the time element.
Torque is defined as “a twisting force that tends to cause rotation”. We’ve seen that force and motion don’t have to be rotational (twisting) to be measured, since the work pony example used foot pounds and horsepower, moving weight against gravity. In the automotive world it’s appropriate to focus on a particular type of force, torque, which is a twisting force.
Horsepower is simply the rate that torque is applied. If we apply 100 lb.-ft. of torque at the rate of 2,000 rpm, this is an amount of horsepower. If we apply the same amount of torque, but twice as fast, at 4,000 rpm, doesn’t it make sense that this would be twice as much power? Likewise, doubling the torque but maintaining the same speed would logically result in twice as much power. So, how are torque and horsepower related?
One definition for horsepower is 33,000lb.-ft. per minute (550 x 60). This was Watt’s definition, based on observation and subject to averaging.
The Magic Formula
Hp = (T x RPM) / 5252
The formula clearly shows what we’ve already figured out – doubling either torque or rpm doubles the horsepower. Said another way, change in power varies directly with change in torque or speed.
Where does the constant 5252 come from?
Consider a simple example where we have a crank that we’re turning to do work. The arm is one foot in length, so we’re providing force that distance from the center of rotation. For each revolution, the distance is 2 x π x r, where r = radius (1 ft.). So, distance per revolution = 2 x 3.1416 x 1 ft. = 6.283 ft.

Now we need to determine how far the crank moves in one minute. We’ll assume a hand crank in this example, so let’s use 120 rpm.
Distance per minute = 6.283 ft. per rev. x 120 rpm = 754 feet per minute (rounding slightly).
Let’s calculate the power:
POWER = (FORCE x DISTANCE) ÷ TIME
Power = 10 lb. x 754 ft. per minute = 7,540 lb.-ft per minute (we’re using 10 lb. of force)
Now we need to relate this to horsepower. Recall that one horsepower is defined as 33,000 pound-feet of work per minute. So, HP = POWER (ft.-lb. per min) ÷ 33,000.
So, we were generating:
HP = (7,540 ÷ 33,000) = 0.228 HP, or just under 1/4 HP
They’re Both the Same!
Don’t be confused by the two examples (bricks and crank), with one doing work by lifting a weight and the other doing work by turning a crank. Force is force, whether we’re lifting a load against gravity or applying the same force to move a load horizontally, or to turn a crank. The π that was introduced is simply because with circular motion we need it to calculate the distance element.
Where’s My Constant?
We still haven’t seen the constant 5,252 though. Consider the following.

OR
(1) FORCE = TORQUE/RADIUS
We’ve already established that:
(2) DISTANCE per minute = RADIUS x 2 x π x RPM
…and that:
(3) POWER = FORCE x DISTANCE / TIME (minute)
Let’s put FORCE from (1) ands distance per minute from (2) into equation (3):
(4) POWER = (TORQUE ÷ RADIUS) x (RPM x RADIUS x 2 x π) (We divided by Time, in accordance with (3), which was 1)
We saw earlier that we needed to divide power in lb.-ft. by 33,000 to find horsepower. We therefore need to divide both sides of equation (4) By 33,000:
Dividing power by 33,000 gives us horsepower, in accordance with the definition. We have to divide the other side, too.
POWER/33,000 = [(TORQUE ÷ RADIUS) x RPM x RADIUS x 2 x π)] / 33,000
…which is:
HP = (TORQUExRPMxRADIUS x 2 x π)
RADIUS x 33,000
…which simplifies to:
HP = (TORQUE x RPM x 6.28)
33,000
We can clean up our constants by dividing by 6.28/6.28 (this is 1):
33,000 ÷ 6.2832 = 5,252 (rounded) THIS IS OUR 5,252!
…which gives us:
HP = TORQUE x RPM
5,252
Also, rearranging gives us:
TORQUE = HP x 5,252
RPM
This is a simple rearrangement of the previous formula. It is exactly the same otherwise.
Significance of 5,252 RPM
At 5,252 RPM, torque and Hp are equal. Below this speed the value of torque is greater than the value of Hp. At any point above 5,252 RPM, the value of torque is less than the value of Hp.
We should be able to tell that at RPM = 5,252, the RPM and 5,252 cancel, leaving HP = TORQUE. Indeed, given that HP is derived from Torque and RPM, a graph of the two will cross at 5,252 RPM. It must! Look at this and convince yourself that this is true.
This should also tell you that you can derive the horsepower curve from the torque curve, and vice versa. All you need is pencil, paper and calculator. How accurate your derived curve will depend on how many data points you take from the given graph and how accurately you measure those values.
Engine Example

This is a horsepower/torque graph made from a vintage dyno sheet for a 426 Hemi. The gray series for calculated horsepower is based on the torque values and HP = (T x RPM)/5,252. Notice how well the values calculated from the torque figures lay on top of the HP values from the dyno sheet. The values at 3,200 rpm are a bit off, likely due to human error. Still, it proves the point that HP values are derived from torque and rpm. The orange arrow is the torque peak, and the blue is the HP peak; the red is 5,252 rpm, where the curves cross. Note that the rated HP for the 426 was 425 HP at 5,000 rpm. That’s what it makes at 5,000 rpm, but that isn’t the peak rpm. 465hp @ 6,000 rpm would have been more accurate.
Note the red double arrow that indicates the range of engine speed where both torque and RPM are rising. Past the torque peak rpm and until the horsepower peak rpm, the rpms are rising faster than the torque is falling. At the HP peak and beyond, torque is falling faster than the rpm are rising.
Two Very Different 3.0L Engines
Consider one last illustration. Two 3.0L engines, one a passenger car and one a race car. They both make 260 lb.-ft. or torque, the first at 5,000 rpm and the second at 16,000 rpm. For the passenger car, this equates to 247 hp. But, for the race engine, the 16,000 rpm is over three times higher, as is the horsepower of 792 hp. Torque or rpm; increase one or both to increase horsepower.


When you hear that old adage about torque and horsepower, you should well appreciate that you need both. From an automotive perspective they are a bit like the two different sides of the same coin.
Explaining Horsepower and Torque to the Uninitiated
Should someone not well versed in things engine and car-related ask you to explain torque and horsepower, the following description might be a good place to start.
“Torque is twisting force, such as the twisting force the engine applies to the crankshaft or to the driven wheels. No motion is needed to have torque, just force. Torque producing motion is power. Horsepower is just a specific measure of power, others being watts, calories per hour and BTUs per hour. There are other definitions, in addition to these.
Horsepower can be viewed as the ‘rate that torque is applied’ or ‘the movement that the applied torque creates’. Double the torque at a given speed is double the power. Double the speed at a given torque is double the power. Since horsepower is the product of torque and speed (time), you need torque to have horsepower, but torque (force) without motion (speed, time) is just force applied in a rotary manner.”
Measuring and Rating Horsepower
After 1970 engine horsepower dropped significantly, mostly due to greatly lowered compression ratios to allow engines to run on unleaded gasoline. The lower horsepower numbers were also due to a change in the way engine horsepower was rated. For the 1971 model year, some manufacturers issued both net and gross ratings, but everything transitioned to SAE net in 1972.
Engines had long been rated by the SAE gross method. This involved the engine being mounted to a stand, with no air breather and filter, no alternator, no fan, no water pump and with headers replacing the factory exhaust manifolds. Ignition and carburetor jetting were adjusted for the best values.
It Wasn’t Just Compression Ratios
I don’t want to leave you with the impression that compression ratios were the only thing that changed in the early ’70’s. This was merely the most visible thing. Additional changes were related to a diminished focus on high-rpm horsepower, which was not compatible with lowered emissions. The casualties were cam duration, overlap and lift, carburetor jetting for maximum power and engine timing for the same.
Correction Factors
Correction factors exist to standardize torque and horsepower measuring, in much the same way the SAE Net method standardized the physical setup of an engine under test. Ideally, if two different test facilities tested the same engine in the same city, on the same day (equal temps/humidity/barometric pressure), they would both reach identical measured values. The SAE Net standard ensures that this is the case.
Maybe you have an engine that’s dyno tested on a cold winter day. Months later, you require another dyno run, but it’s now a hot summer day. No, the engine won’t be running outside either time, but the ambient air temperature will likely vary significantly with the outside temperature. Not only will the temperature be different, but so will the air pressure and the relative humidity. Trying to compare the two sets of dyno testing data will be meaningless without using some manner of meaningful correction, to eliminate these variables. That is exactly why correction factors exist.
Society of Automotive Engineers (SAE) Standards
Volumes of books could be written about SAE standards that apply to engine power and torque ratings. Most of this would be as boring as crap. It also seems that the SAE doesn’t like to release the standards themselves free of charge! Just know that numbers like J1349 and J2723 are the references to current standards.
Dynamometer Testing
If you’re building a high-dollar engine, or having one built for you, that engine will likely have its torque and horsepower measured on an engine dynamometer. This process would look something like the following image of an engine being dyno tested on a Dyno mite test system.

Unless you’re an engine builder, if you have had an engine dyno tested, it’s likely that this was with the engine installed in the car and horsepower being measured at the rear wheels of your car. This, of course, refers to a chassis dynamometer.
The horsepower being measured with a chassis dyno is obviously going to be a lower value than measuring the power at the engine crankshaft. A general rule of thumb is 15% for the losses from the crank to the rear wheels. This is a ballpark value and can’t really be used in any meaningful way, other than for general understanding.

Gotta Have a Load!
Regardless of whether an engine is being dyno tested in-vehicle or out, there must be a load placed on the engine to allow the engine to do work that can be measured. The manner of load depends on whether it’s an engine dyno or a chassis dyno, and then somewhat on the design choice of the dynamometer manufacturer.
One common load method is a water brake.

The work of moving the water (much like the fluid in an automatic transmission torque converter) will heat the water. This requires the use of a water source and drain, to keep the brake water temperature within allowable range.
Eddy Current Brakes
Another load method is by use of Eddy Current Absorbers. These are essentially a rotating metallic disc assembly, that is rotated in a magnetic field that is established by a number of electromagnet pairs, through which an electric control current is flowing. The rotating disc assembly is more complex than a simple ‘disc’, but we’ll use it to explain the process.
When the engine under test causes the disc to rotate, the electromagnetic field that the disc is in will cause current to flow in the disc, in a circular manner. Think ‘water eddy’, and it should make more sense. The induced current flow in the disc will form its own magnetic fields, which oppose the fields generated by the electromagnets. The disc material doesn’t even have to be a magnetic material, like steel; aluminum is conductive and will work just fine. How do we vary the load on the engine? Simple—just allow more or less current to flow through the electromagnet coils!

Cooling
With eddy current brakes, the cooling can be by air or by water, depending on the particular unit. The water brake diagram shows a torque meter. Both the water brake and the eddy current brake will have some way to measure torque, likely one of the many types of semiconductors or solid-state torque or strain gauges. These will interface with a PC, running an application provided by the dynamometer manufacturer, if there is one, or the brake manufacturer.
The same PC will have an output to the current control device, if it’s an eddy current brake, and an input for the speed sensor. Using the measured torque and speed to calculate horsepower is really straightforward. Of course, the application will also do graphing, storing and archiving of run data, and other things to make the operator’s life easier.
Eddy Currents are …Good?
In this case, ‘yes’, but more generally, ‘no’. In electronics, eddy currents are usually associated with lost energy. Take a power transformer in some old-school electronic device. This will be the big, heavy one that takes the 120VAC wall voltage and converts it into lower voltages for the device’s electronics to use. You may already know that these things get hot! If you take a careful look at the metallic core, you can see that it is often composed of slices of metal that are packed together to make a seemingly solid core. These slices are actually coated with a shellac to provide electrical insolation from one another.
With an AC transformer, the alternating current provides the change that induces a voltage in the secondary winding, and, unfortunately, the core itself. This special construction of the core is designed to force the eddy currents induced to flow in these thin strips, preventing them from creating the losses they would with a truly solid core. The eddy currents account for most of the considerable heat a power transformer generates. In this scenario, this is wasted energy and loss of efficiency.
When 2 + 2 ≠ 4
I think you should be forewarned about this section. It’s going to get messy. Not with math so much, but just trying to sort truth from fiction, in the light of a relative few engines being intentionally under-rated by their factories, the reasons for doing so, and the myth that’s arisen over the years that would have you believe that all muscle car engines were under-rated. Add the myriad of dyno runs on ‘stock’ engines over the years, and it’s a messy picture. It’s going to take some sleuthing, and conclusions are going to be a bit tentative at times. There will be some situations for which we might not be able to reach a confident conclusion.
Sometimes engines from the muscle car era have peak torque and horsepower figures that just don’t seem to add up. There were plenty of times where the horsepower figure for a particular engine seemed too low. At times the same engine would be seen in a different model and would be rated maybe 30 hp lower than in its sister model. What gives?
Years ago, this issue was tackled by the auto journalist Roger Huntington, a brilliant, self-educated man. Roger practiced his craft in the 1950’s and ‘60’s and had a unique and entertaining writing style.
Mr. Huntington determined that for a 1960’s engine, you could look at the torque values and then estimate the peak horsepower and rpm values from them. The assumption (usually true) was that the torque value and rpm were accurately reported, while some of the power figures were given at an engine speed that was actually lower than where peak hp occurred. Which brings us back to our original question.
But Why?
The reasons for under-reporting a horsepower number were varied, but usually involved one of a handful of factors. Chevrolet rated their hottest Corvette 427 engines at 430 and 435hp, fifty horsepower or more below the peak. At a time where a 475 or 480hp figure might bring unwanted attention from the safety radicals or the insurance industry, they figured if you’re buying one of these, you knew the true performance. They weren’t interested in selling thousands of these race-only engines, either.
For Chrysler and their 426 Hemi, I suspect much the same motivation. This was a street engine, but the buyers knew the real performance, and it was some 50Hp+ higher than rated. Yes, is did make 425Hp at 5,000 rpm, but the power peak was at 6,000 rpm, where it made 465-470Hp. The reported 425Hp@5,000 rpm was true, it just wasn’t the peak!
There were other examples, as well. This doesn’t mean that the average muscle car engine was under rated; it wasn’t.
Let’s Just Dyno the Crap out of These Things!
A reasonable suggestion might be to look at old dyno figures or to conduct dyno runs on stock classic engines to once-and-for-all settle the questions about what factory horsepower values should have been for particular engines.
There have been many, many dyno tests of classic engines that were done back in the day or more recently. In some cases, there was a large amount of information about the engine being tested, and in other cases there was very little. One major magazine/web site in 2015 conducted a dyno ‘shootout’ between a Boss 302 and a Boss 351. Both were intended to be rebuilt to as close to stock condition as possible, but tube headers were used because vintage exhaust manifolds were hard to come by. MSD supplied the distributor and COMP Cams the valve springs and miscellaneous related hardware. Both used the same later-day Holley 750cfm carb. The following values are from their testing.
Boss 351: 383 hp at 6,200 rpm and 391lb-ft of torque at 4,000 rpm. From measured torque, formula predicts 380hp@6,000 rpm (See below).
Boss 302: 374 hp at 6,700 rpm and 324lb-ft of torque at 4,300 rpm. From measured torque, formula predicts 338hp@6,450 rpm (See below).
Boss 302 Strip Performance
Hot Rod magazine put the 1970 Boss 302 to the test for their January 1970 issue at Orange County International Raceway in Irvine, California. Their best quarter mile time was 14.62 seconds at 97.50 miles per hour. Most vintage accounts of Boss 302 quarter mile runs had similar mid-fourteens times at from 93 to 97mph or so. This is with the manual four-speed and 3.91 gears which were standard. To me this doesn’t sound like a 3,200lb. 350+ hp car.

I wanted to include a picture of the Boss 302 exhaust manifolds to make a point about the above-mentioned dyno run and the real-world performance of this engine. These aren’t the worst exhaust manifolds I’ve seen, but they’re certainly not like the gorgeous Ford 427 manifolds. I believe that this engine is one that really, really benefited from a good set of headers, because the stock exhaust did indeed inhibit airflow significantly.
An Epiphany?
This leaves me at a bit of a loss. Do I believe that a Boss 302 was factory dyno tested at 370+ hp and intentionally under-rated by some 80hp? I struggle with that. The historic quarter mile times don’t seem to support it. It should have kicked the ass of the Chevy Z/28 in the quarter mile, yet it seems that the two cars were comparable in this respect. The only other answer would be the factory under-rating of the Z/28, which, again, I struggle with. I mean, if the DZ 302 really made 350+ horsepower, how much did the hottest 327 make with the same heads? The 327 is 1.083 times the displacement of the 302. That would put the hottest 327’s at 379hp. The L84 actually did make between 360hp and 375hp, carbureted and fuel injected, respectively. Hmmm… I’m thinking that my past thoughts about these two engines were mistaken, and that they were indeed substantially under-rated by Ford and Chevrolet.
The Larger Boss
How about the Boss 351? It seems to have been a legitimate high-thirteen second car, at just slightly heavier than the Boss 302. Yeah, I can accept 380hp as legitimate. Bottom line, I guess, is that there are three engines (2 – 302’s, 351) that I’ve added to the list of engines that were substantially under-rated by their factories! Indeed, some head port cleanup and a good set of headers would indeed allow either of the 302’s to reach and exceed 400hp at ungodly high rpms. Would the stock valvetrain hardware allow 6,500rpm+ operation without issues? Probably, but as with this article, valve springs and related hardware could be installed that might give you more of an rpm margin.
What about headers? It’s always seemed a bit unclear as to whether any particular engine was factory dyno tested to the Gross test standard with factory exhaust or with headers. If we subtract 40 – 50hp from these horsepower figures, as they were produced with headers, we are now in the ballpark of the predicted (see following) power values. Not all engines will benefit as significantly from headers as these high-revving free breathers will, but the 40 – 50hp range should be fairly accurate.
Gross or Net?
The change from gross horsepower factory ratings to net horsepower ratings has created confusion that has persisted until this day. In a nutshell: Assume that vintage horsepower ratings are gross. Assume post-muscle car era dyno ratings (including contemporary) are gross unless specifically stated. Modern factory ratings are SAE net, but it is my belief that the vast majority of engine dynamometer runs do not adhere to the same net procedures as the factory does.
The ‘Huntington Formula’
Mr. Huntington determined that an engine has a Hp peak rpm that’s about 1.5 times the torque peak rpm, and that at the peak Hp rpm, the torque value is about 85% of the torque peak.
Expressed as a formula:
HP = (TQ x .85 x RPM) / 5252 where RPM/h is the peak HP rpm (1.5 x Tq peak rpm)
This is a rearrangement of the formula HP = (TQ x RPM) / 5252.

Here’s the formula in use, using 426 Hemi factory values of 490 lb.-ft. @ 5000 rpm and 425Hp @ 5000 rpm. We’re calculating the true horsepower peak at 1.5 X 4000 = 6000rpm, and that at this rpm, torque is 85% of the rated value (490 lb.-ft.), or 416.5 lb.-ft. 416.5 X 6000 = 2,499,000. Dividing this by 5,252, as per the formula, gives us 475.8Hp.
I should add right now that the values I’ve looked at and worked with do not fully endorse the Huntington formula of torque being 85% of peak at the peak horsepower rpm and this rpm being 150% of the peak torque rpm. This takes nothing away from Mr. Huntington and the wonderful work that he did. I view it as simply carrying it forward just a bit.
I Always Thought I could do Basic Math…
The following table’s values are from a more recent web page, being attributed to Mr. Huntington. Presumably these are the same values I saw some forty years ago in that magazine article. To this information there have been added four columns: Formula HP – values found using the Huntington formula, HP Diff% – percent difference between article (Huntington) calculated values and Formula HP field, RPM Diff – difference in rpm values between the two columns, and Comments.

The green boxes represent values with minor differences in calculated horsepower and hp rpm. Orange indicates moderate differences and yellow indicates large differences.
OBSERVATIONS
- Buick 455 torque is at an unusually low rpm, so it’s true Hp rpm is much higher than the formula predicts, as is the horsepower value.
- Chevy 396 L-78 torque value is unusually low, resulting in a low predicted Hp rpm and value. Actual Hp is over 400.
- Mopar 340 is underrated.
- Except the 426, Mopar torque rpm values seem low, resulting in low predicted Hp rpm and values.
- Both Chevy DZ302 and Ford Boss 302 factory Hp values are approximately correct.
- Ford 428 factory Hp rating seems to be entirely made up.
- Olds 455 W-30 is substantially underrated by factory.
- Chevy 427 L-88 and Mopar 426 Hp values fit formula value well.
- Pontiac 400 RAIII and RIV engines were underrated by factory; formula RAIII value is high, but RAIV value seems proper.
Questions:
- Why don’t the values attributed to Mr. Huntington (‘Article HP’) reflect the ‘Formula HP’ values that were produced with the formula?
- Is the Huntington formula too rigid to account for various engine variables?
- In the decades that Mr. Huntington’s formula has been featured in magazines and web sites, hasn’t anyone checked the math?
- It would seem that some engines (Olds, see below) were indeed under rated by their factories.
- The motivations for under rating seem obvious, but why over rating? That would seem unethical.
- Is the premise that torque values are always reported accurately not reliable?
Olds 455s
The following table might help shed some light on the discrepancies between calculated and true horsepower values. Surprisingly, it indicates that Oldsmobile intentionally over-rated the horsepower of their lower performance engines!

The ‘True HP’ values are from the engineering report, with the last column being calculated from the Huntington formula. There are some interesting takeaways from this information. First, the W30 cars were indeed under rated, but I don’t believe the actual output was in the 430hp range; strip performance does not support that. 400 to 410hp is more likely. I could certainly accept 380 to 390hp for the standard 4-4-2. Other values seem to agree fairly well, while others don’t.
So, what can we conclude? First, I’d say that I don’t understand the 370hp ratings for the W30 cars, as real-world performance would dispute these as being too low. If you can’t trust the manufacturer when they say that Engine A makes more horsepower than Engine B, what can you trust?

This Olds camshaft table might help explain the Olds Engine table values. The W-30 had a wild cam, and the engine should have outperformed the other ‘big car’ 455’s. The camshaft table seems to support the engine table. When comparing engines of the same displacement from a given automaker, perhaps the rule might be: “Start with the torque value and rpm as a starting point, then look at the heads (ports, valves), camshaft, manifolds, carburetor and compression ratio to see if the value makes sense”. In the case of Olds, an engine with a milder cam but a higher horsepower value is highly suspect at best.
But why did Olds Obfuscate?
Okay, I intentionally didn’t use the word ‘lie’ when referring to Oldsmobile; I’ve reserved that term for Ford (see 1950’s Ford info. for made-up ‘awards’). What would motivate Olds to overrate their lower output engines?
Consider that just a tiny percentage of Olds’ 455 engines would go into 4-4-2’s. Most would go into the larger models, which were the bread-and-butter for Olds. Perhaps management thought that a forty-something businessman in his 98 might be bothered by the thought that the pimply kid next door in his 4-4-2 had a more powerful engine. Half of Olds’ 1970 sales were large cars, with only about 3% going into the 4-4-2. Kinda makes sense to me. What do you think?

This is a look at the BOP 455 engines for 1970. What stands out? First, the Buick torque rpm values are incredibly low. This engine is known to be unique for its healthy (actual) horsepower and its ungodly low-rpm torque. It clearly defies the Huntington formula, but that’s already known.
Being the undeniably bright person you are (despite what a few might say), you ask “Why don’t we just look at dyno results?”. Well, which dyno results? All engines were indeed dyno tested by the automakers during development, but this information is not readily available. Dyno results from non-factory sources have to be disregarded as representing true factory output values, despite any claims that are made about ‘bone stock’. I think that’s where 400hp dyno runs for DZ302 and Boss 302 engines came from. Yep, these engines can truly make this kind of power, but not factory stock.
Playing With the Numbers
It may have already crossed your mind that the ‘150%’ and ‘85%’ values of the Huntington formula (see above) might be okay rules of thumb but can’t be taken as absolutes. What if the torque at peak hp isn’t necessarily 85% of the peak torque, but more like 80% to 90%, and what if the power peak rpm isn’t at 150% of the torque peak rpm, but perhaps 145% to 155%? We can play with these constants (yeah, then they’d be not so constant) to see what drops out.
You will see three sets of engines in the following table, those with white, yellow and red backgrounds. The white represents the engines for which the formula was fairly accurate; the yellow entries estimated horsepower too low, and the three in red were engines that were intentionally under-rated by their factories. Please see the column definitions below the table. We focused on Chevy, Ford and Dodge engines here.

Field Definitions


All of the engine HPRPM/TQRPM ratios are plotted in the ‘Base Calculations’ graph. Note the reference 1.50 multiplier white-dashed line. It’s clear that there are more ratios greater than 1.50 than below. If we threw out the out layers like 1.25 and 1.83, the value of 1.55 looks like it might be a good average, just eyeballing it. These are based on the factory torque and hp rpm values.
Low HP Values
Let’s focus on the three engines designated in red as ‘poor fits’. These are the three engines that were intentionally under-rated, the Chevy 427, Ford 428 and Chrysler 426. Both the Chevy 427 and the 426 Hemi were assigned peak horsepower values well down on the horsepower curve, especially the Hemi. For the Ford 428, it looks like Ford just decided to take 10% off the peak horsepower value and leave the rpm as-is.

Note that for the 427 and the 426, the ratio of factory HP peak rpm to torque peak rpm (RPM Ratio Hp/Tq) values are considerably lower than the 1.5 the formula uses. That’s what I would expect for these two engines. The 428, at 1.53, is in the range of most engines. That’s what suggests what seems to be a “screw the HP curves” attitude for the 428.
It is probably worth pointing out that the Police Interceptor versions of the Ford 428 were rated at 365hp. Might this be the true value for the 428 in general?
High HP Values

The seven engines highlighted yellow (two are just different versions) represent engines for which the formula under-estimates both HP and peak HP rpm. Note the high RPM Ratio Hp/Tq average of 1.65, substantially higher than 1.5.
For these engines it appears that the ratio of 1.5 is not accurate. A graph of these values follows. The white-dashed 1.65-line shows the average.

Ratio Values
Now we’re going to consider that the ratio of RPMHP to RPMTQ might be other than 1.5. We’ll play with this ratio to see what falls out. The ‘HP calc’ and RPM calc’ column values will change, as indicated by the light blue text.

Here are the same engines, recalculated with ratios higher than 1.5 (ADJ Ratio). This brings the ‘RPM Calc’ values closer to ‘HP rpm’ values, with resulting drops in ‘HP Err’ and ‘RPM Err’ values. With these tweaked ratios, we can get HP and rpm values with error figures in the single digits. Note that the last column still represents ratios based on factory rpm values.
The ‘Adjusted Ratio’ chart shows how we can tweak the ratio a bit lower and get a pretty good fit (low error pct.) using the base 0.85 (85%) multiplier. The TQ RPM/ HP RPM ratio average only went from 1.65 to 1.61. However, both the HP Err and RPM Err averages plummeted to less than a third of what they were in the earlier table. Err Total dropped by 75%.
The three columns in light blue contain adjusted values. When we adjusted the ‘ADJ Ratio’ field, this resulted in changes to ‘HP Calc’ and ‘RPM Calc’.
Adjusting Torque RPM
Let’s look at the situation again, but we’ll leave the ratio at 1.50 and adjust the rpm of the torque peak. The ‘ADJ TQ rpm’ column has been adjusted upward. This will change the ‘HP calc’ and ‘RPM Ratio H/T’ columns, both of which are in light blue.

In making these adjustments, the TQ RPM average only rose by less than 250 rpm, and all of the adjusted torque rpm values seem reasonable. This is especially true given that a few of the factory torque rpm values seem on the low side, like the values for the 300 hp 327, the Ford 429 and the Dodge 318.
What have we accomplished? The 17.24% error total decreased to 11.32%. Fine, but not nearly as good as the 4.56% error total we got by adjusting the HP RPM/TQ RPM ratios.
We can conclude that some torque rpm values probably are low and should be slightly adjusted higher. This would be particularly true with a broad torque curve where the peak torque value might be a bit arbitrary. This isn’t going to be nearly enough to allow us to make a formula that fits the observed values better, though.
Multiplier Values
Next, we’ll consider that the torque at the HP peak rpm might be something other than 85% of the peak torque. The ‘Mult’ column will no longer be fixed at .85. The column ‘HP calc’ values will change, with this text in light blue.

In the Adjusted Multiplier table, we are pursuing the thought that torque at peak horsepower rpm isn’t necessarily 85% of the peak torque value, but we’re still using the peak Hp rpm value of 150% of peak torque rpm. The light blue columns represent the changed multiplier and the resulting changes to ‘HP Calc’.
As above, we’re adjusting one variable at a time. The resulting Err Total is in the same ballpark as the previous table where we adjusted peak torque rpm values.
Let’s look at the engines that are good fits to the existing formula.
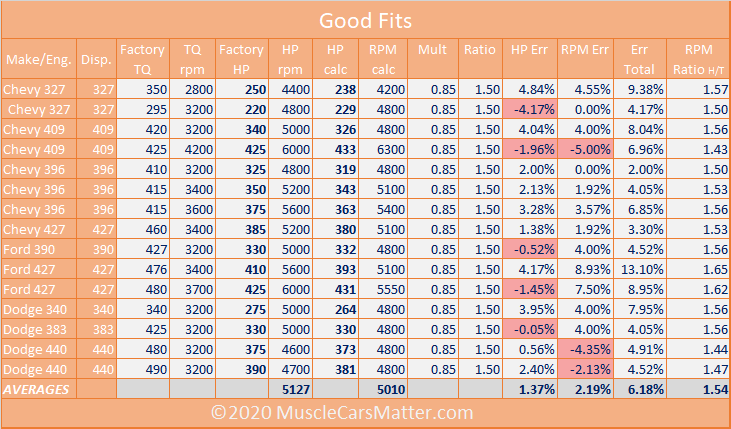
This table uses the base 0.85 multiplier and 1.50 ratio, as well as the factory torque rpm values. The results are reflected in the low 6.18% total error value. For these engines, the original formula fits pretty well, as evidenced by the RPM Ratio H/T average of 1.54, not much higher than the 1.50 of our formula.
The red-highlighted error values are negative, where the formula predicted either a horsepower value that was too high or a hp rpm value that was too high.
With the 1.50 highlighted for reference, it’s easy to see that there are more engines above the line than below.
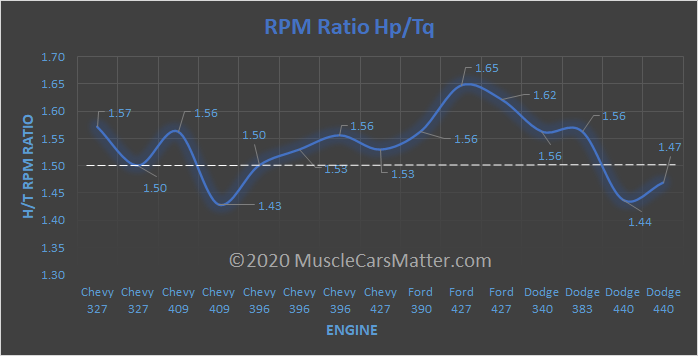
One final look at all of the engines, with the five standouts(3 engines – 5 flavors) highlighted.


These values are from the Base Calculations table, so it’s the same information presented in a visual format.
Okay, What Does all this Crap Mean?
What’s the take-away here? First, we can’t accept as fact that all torque and torque rpm values are valid. Maybe most are, but there are notable exceptions.
Second, the values of .85 and 1.5 do indeed fit a lot of engines., but not all.
Third, the rpm ratio of 1.5 or 150% might more accurately be stated as 1.5 to 1.6.
Fourth, the torque multiplier of .85 or 85% might be too general a characterization.
In all likelihood, if we were to take a deep dive into the engines that didn’t fit the formula but were not intentionally mis-rated by their factories, we would find that the two variables (.85 and 1.5) were slightly inaccurate in one or both. This assumes accurate torque specs. We might find commonalities, such as ‘engines that are rated at higher than .9Hp/in3 tend to have <blank> values closer to <blank>’, or some such thing. We simply can’t rely on 3rd party engine dyno figures.
Further investigation would be needed to determine the variables that determine the specific ratio for any particular engine.
What About Other Engines?
Remember that the formula, with original or adjusted multipliers, is fairly accurate for 1960’s OHV V8 engines, but not necessarily for engines from earlier eras. For example, if you were to run some calculations on earlier engines, say early 1950’s, you would get wildly inaccurate numbers. The predicted horsepower values are consistently lower than the factory values, as is the predicted rpm. I believe variables like valve size, bore/stroke ratio and stroke/rod length ratios were enough different from the later engines to introduce the errors seen. If you do the same exercise with 1940’s engines, the errors become huge. These engines tended to be valve in block, with small valves and with very under square bore/stroke ratios (bore << stroke).
There were times when an engine was used in more than one platform, with legitimate horsepower differences between the two engines/vehicles. This could be due to cam differences or exhaust manifold variations.
1940’s Engine Example
Oldsmobile 257cid Straight eight
Factory rating: 115 hp@3600 rpm, 218 lb.-ft @2000 rpm.
Predicted horsepower: 102 hp @ 3,000 rpm.
Error: Hp 11.3%, HP rpm: 16.7%; Error total: 28%

Modern Engines?
Let’s take a look at one.
2014 Chevy LT1 6.2L (Direct Injection)
460hp @ 6000 rpm
460 lb.-ft. @ 4600 rpm
The standard formula predicts 513 hp @ 6900 rpm! This is an 11.5% error in horsepower and a 15% error in predicted HP rpm. I suspect that if we looked at a generous sampling of contemporary high-performance engines (normally aspirated), we would conclude that the 1.5 multiplier was too high. With the LT1, using a multiplier of 1.3 in the formula makes the predicted horsepower 445 @ 6000 rpm.

How about another one?
Dodge 5.7L Hemi G2
375hp @ 5800 rpm
398 lb.-ft. @ 4200 rpm Error: Hp 8.0%, HP rpm: 8.6%; Error total: 16.6%
The standard formula predicts 405hp @ 6300 rpm. If we use 1.4 as the multiplier, we get 373hp @ 5800 rpm; this is close to zero error!

Conclusion? Well, we should look at more engines, but I’d say that for contemporary high-output engines, the multiplier should likely be in the range of 1.3 to 1.4.
We’ll update this later with a broad sampling of V8 engines, and we’ll see how well they conform to our conclusion of a lower ratio.
Remember, I did tell you that this was going to be messy!
Performance Relative to Horsepower
This is a topic that’s fairly straightforward. The more power the car’s engine makes, the quicker it will be, right? Absolutely! But the more you look into it, the more complex it becomes.
Trying to correlate changes in quarter mile times of a vehicle with changes in horsepower can be challenging. Often variables such as traction, suspension, transmission type and rear end gearing have to be ignored because trying to factor these in becomes too complex.
Calculating HP from ET and Terminal Velocity
There are a handful of formulas that can be used to approximate vehicle ET or trap speed from the weight of the car and its wheel horsepower. I believe Roger Huntington’s work was original, with a couple of people later modifying the formulas slightly. All use a formula of a variable times (car weight / rear wheel HP) 1/3. Different variables are used to calculate ET and mph. The calculations do not take into account variables such as rear end ratio, traction, suspension, or transmission type.
A lot of effort has been put into these calculators, and you can find information on them online by searching “quarter mile calculator”. In the limited time I’ve spent with them I have not become confident in their accuracy or ease of use. Ideally, if you use known vehicle weight and both ET and MPH from a run by a professional driver, the calculated power values using the two formulas should result in numbers close to one another. That’s not what I was getting. Take a look for yourself, and if you reach a different conclusion, please send us your data.
ET and Trap Speed Relative to Horsepower
While we’re not going to try to calculate our horsepower from our ET or trap speed, that doesn’t mean we can’t take a closer look at the subject and come to a better understanding about it.
I recall coming across a web site some time ago that provided a great and simple explanation about the interplay between ET and trap speed. They said that ETs are about traction and trap speeds are about horsepower. Of course, this is simplifying things but it’s really useful to look at it with an example.
You take your 13.5 second, 109mph 1969 Road Runner 440 6-bbl. to the local strip for some fun. In your unrestrained exuberance (and maybe dumbassery…) you do the mother of all burnouts after the tree goes green, spending a full five seconds going nowhere. When the tires finally grab you continue the run. You already know that your elapsed time is going to be in 19 or 20 second range, but what about your trap speed? You might be surprised to see it really close to the expected 109mph. If you think about this, it should make perfect sense that your ET stinks, but your trap speed was unaffected.
Let’s Race!
We can look at just such a car (RR 440 6-bbl.) and the results of a handful of runs done for a Plymouth advertisement in 1969.

This is the section of the ad that detailed the five runs by an amateur driver. The ET spread is 0.62 seconds, or 4.44% relative to the fastest time. Trap speed varies 3.13 mph from slowest to fastest, which is 2.85% relative to the fastest speed. It should make sense that the trap speed spread will be smaller than the ET spread, especially with an amateur driver.
If we do the same thing with the results the ad listed for ten runs by a pro driver, we get both lower ETs and higher trap speeds. The pro driver averaged 2.7% lower ETs and 1.2% higher trap speeds compared to the amateur driver. The trap speeds varied half of what the ETs did because that depends far more on the car than on the driver. A pro driver would be expected to handle the launch and first part of the run better than an amateur, hence the larger difference in ETs. What would be interesting would be to substitute a driver with less experience, having some ETs in the fourteens. I would expect the then see the trap speeds a bit slower, but not all that much.
Can’t We Just Use NHRA HP Values?
This is a point that adds more confusion to the issue than it does clarification. In an effort to properly level the field, the National Hot Rod Association issued horsepower ratings for car/engine/head/piston/trans combinations based on NHRA racing results. The more a combination was raced, the more data was available for accurate horsepower ratings. Default ratings were simply factory values.

This is part of an Excel spreadsheet from the NHRA web site, for the 1969 Mustang 428 and 429 engines. I think I understand most of this data, but I do still have a few questions, such as the exact nature of the apparent date cells. The values such as 8.xx or 9.xx are pounds per horsepower.
What I do know: Hp estimates are based on times run by body/engine/head/piston/trans combinations that compete in Stock and Super Stock. The more runs by a specific combination, the more data points with which to estimate horsepower. Engines that don’t see much NHRA use won’t have many times on record, so the default factory horsepower values may be listed. These values are meaningless and should be regarded as ‘no data available’.

This is the other half of the equation – vehicle weights. You’ll see the same hp values as in the first sheet. The weight values might differ from factory curb weight figures, but not vastly so.
Takeaway
There is a lot of information on the different body/engine/head/piston/trans combinations from the different automakers for the years 1960 to present on the NHRA web site (https://www.nhraracer.com/content/general.asp?articleid=46635&zoneid=132). As you look at these spreadsheets, remember these points: For some combinations there is no data at all; this shouldn’t be surprising. The more a combination has been run, the greater the number of data points and the better the likelihood of accurate horsepower estimations by NHRA. For combinations with a lot of history, NHRA horsepower estimates should be fairly close. Remember that these horsepower values are similar to the old S.A.E. gross ratings and are taken at the crankshaft. These are not rear-wheel horsepower values!
The End
Remember that I told you this section was going to be a bit messy! Part of me wishes more concrete conclusions could have been made, but this is the best that can be done at this time. If you ever come across anything written by Roger Huntington, be sure to take a look at it, as I can assure you it will be interesting.